Gold (XAUUSD) seasonality in financial markets is a well-documented phenomenon where gold prices tend to follow recurring patterns throughout the year. Here's an analysis of the main characteristics of gold's seasonality
Monthly seasonality on gold
January is a particularly bullish month for gold, with 80% of Januarys closing in positive territory over the last ten years, 73% positive months over the last fifteen years, and 70% positive months over the last twenty years. Over the past ten, fifteen, and twenty years, the average return in January for gold has been approximately +5%.
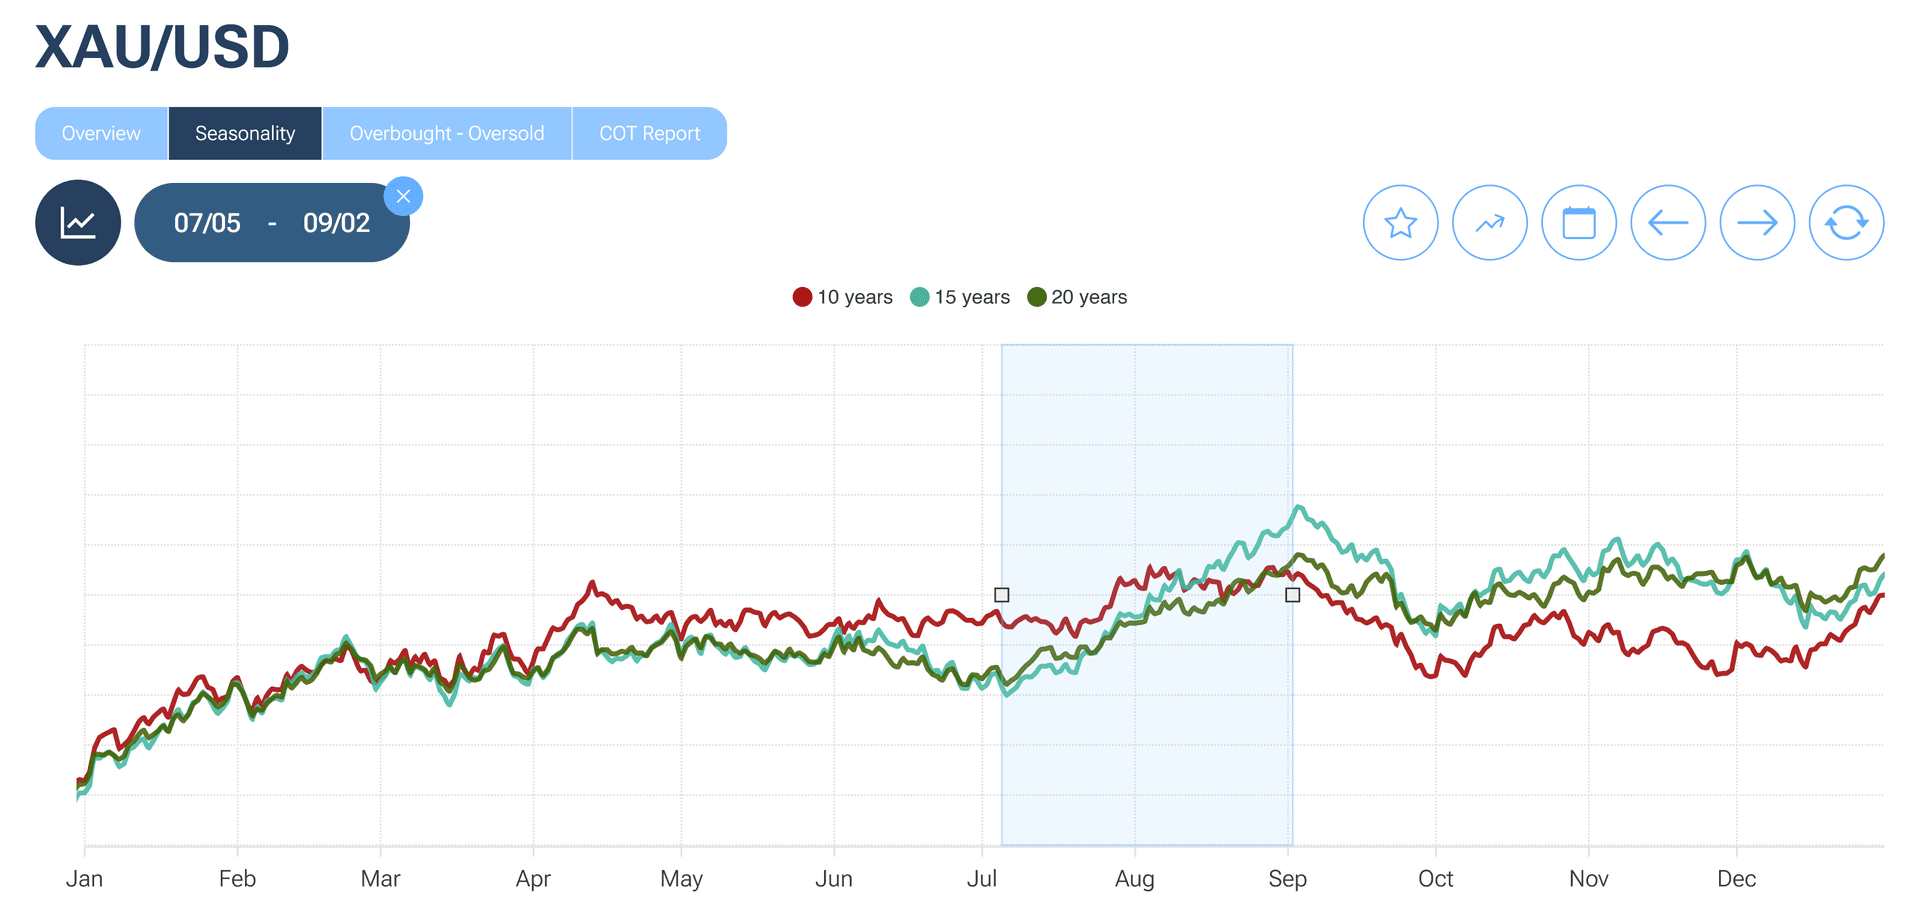
Historically, the worst month for gold is September, with 90% of Septembers over the last ten years closing in negative territory, 73% negative over the last fifteen years, and 60% negative over the last twenty years.
Weekly seasonality on gold
Weekly seasonality is characterized by a typically negative start to the week, with Monday being the worst day in terms of historical performance (negative Mondays outnumber positive ones). In contrast, Friday is historically the most positive day, with the majority of Fridays over the last ten, fifteen, and twenty years closing in positive territory.
This intriguing seasonal pattern is likely due to large investors purchasing gold before the weekends, seeking protection against potential geopolitical events that might occur over the weekend when financial markets are closed. These same investors then liquidate their gold positions once the week begins, reallocating their capital to more profitable assets. This behavior could explain the rise in gold prices on Fridays and the decline on Mondays.
Daily seasonality on gold
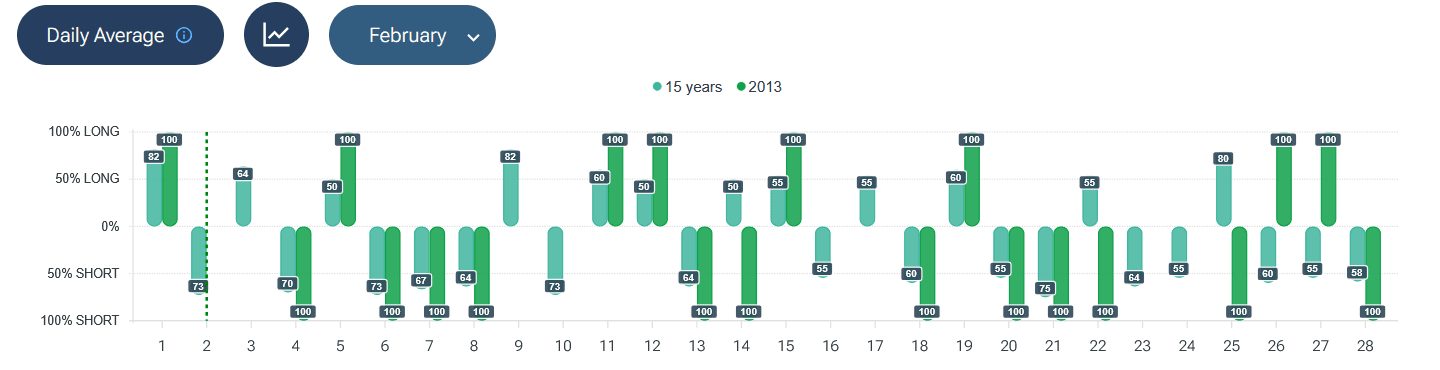
Historically, the most positive day for gold, according to historical data, is the ninth of October. On this day, gold has closed higher 86% of the time over the last ten years, 91% of the time over the last fifteen years, and 93% of the time over the last twenty years.
Conversely, the worst day for gold is the fifth of December. On this day, gold has closed lower 86% of the time over the last ten years, 90% of the time over the last fifteen years, and 86% of the time over the last twenty years.
Best XAUUSD (gold) trades during the year
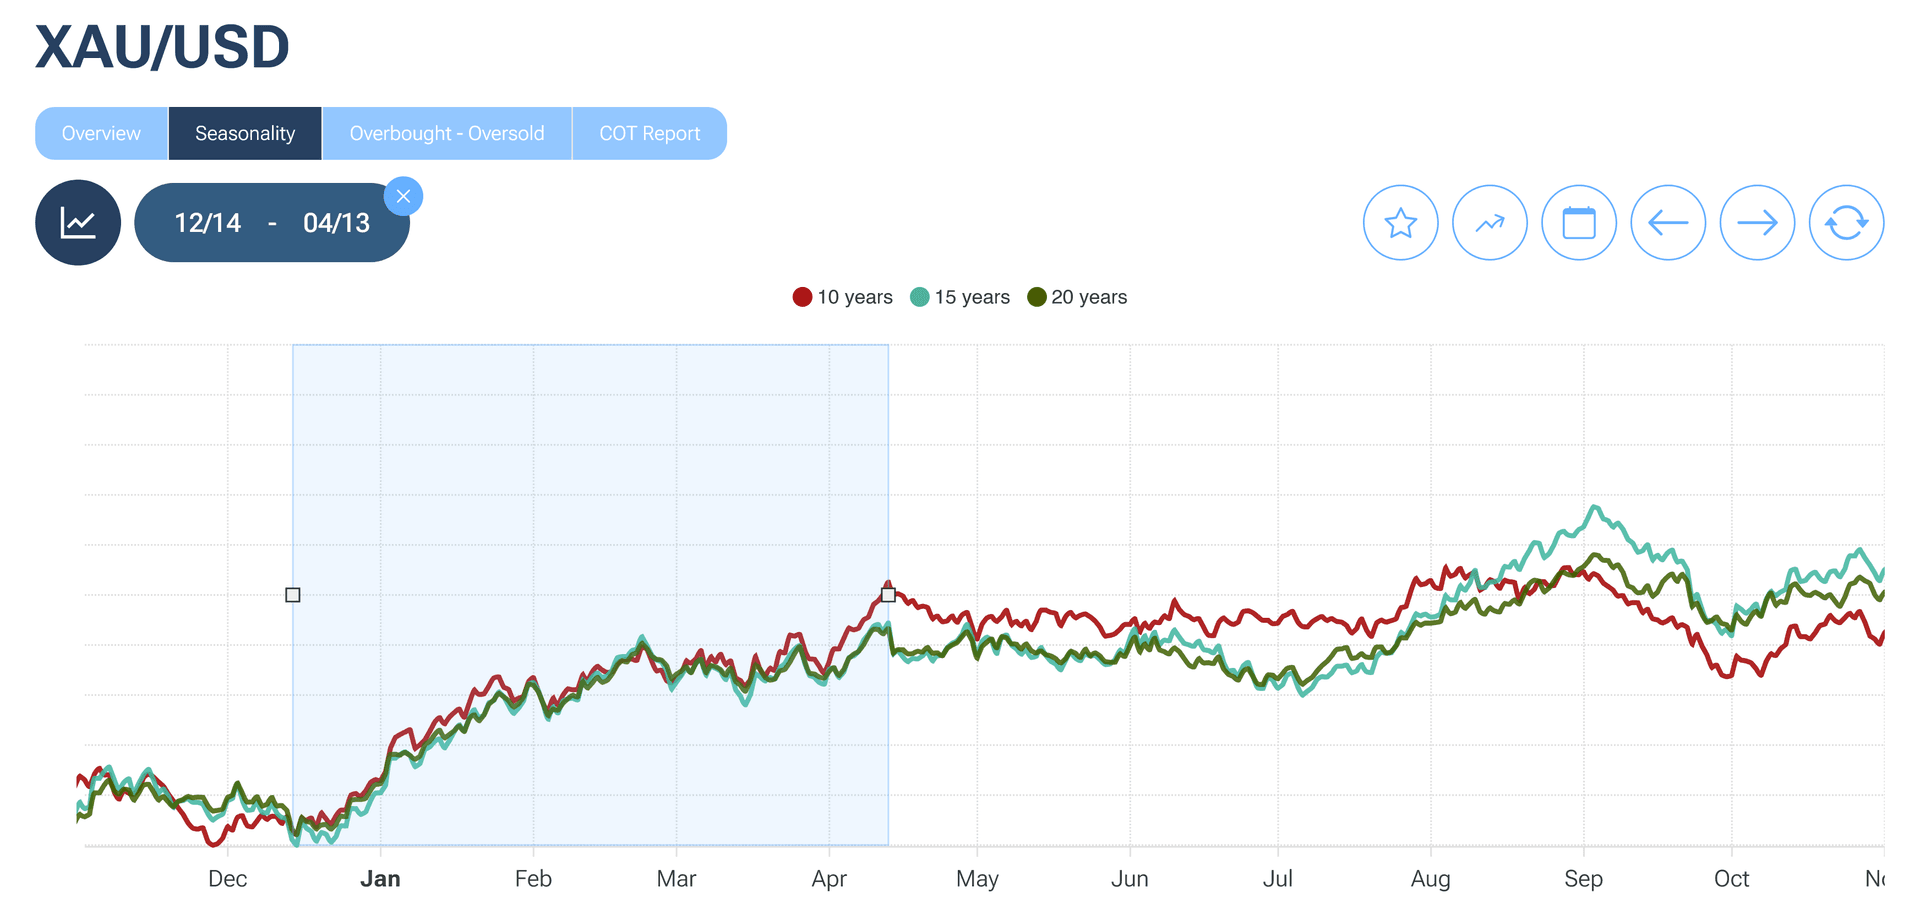
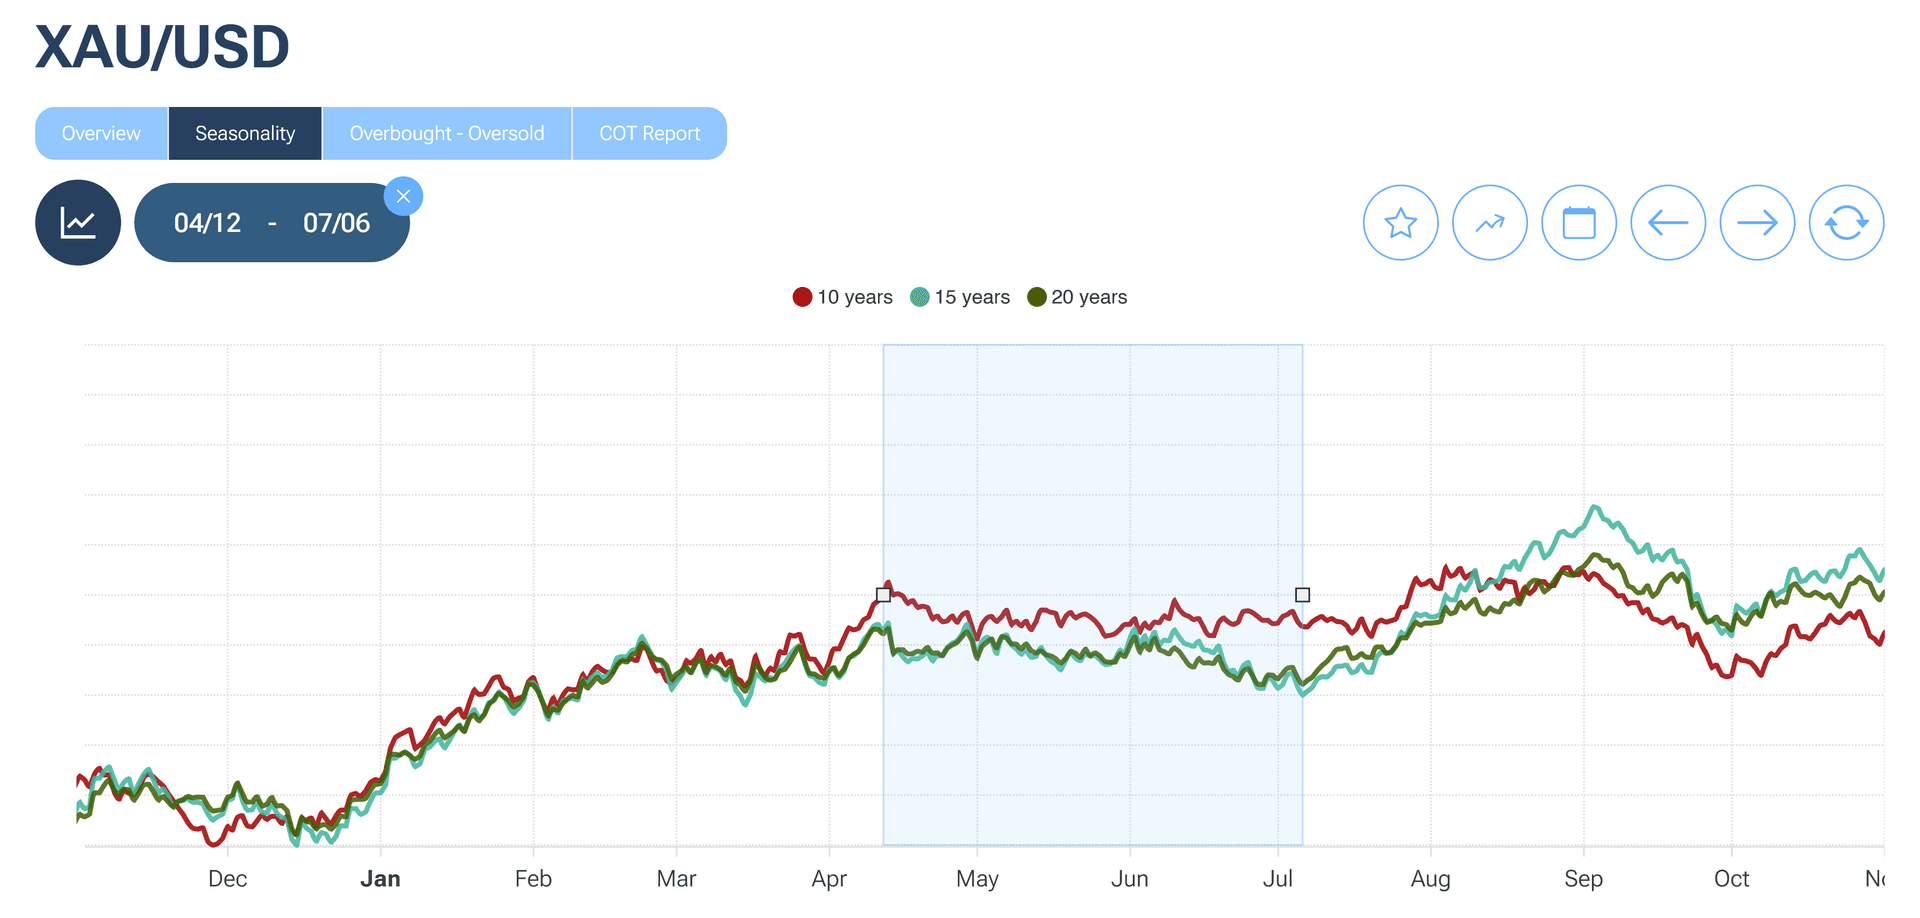
Looking at the ten-year, fifteen-year, and twenty-year XAU/USD seasonality chart, we can identify three macro trends that develop throughout the year:
From Mid-December to Mid-April:
During this period, gold shows a strong tendency to rise. Over the past ten and fifteen years, 80% of these periods have closed positively, with average returns of +11.1% and +9.1%, respectively. Over the last twenty years, this period has seen gold prices rise 75% of the time, with an average return of +10.2%.